Choose the right boundaries
Search the growing library by country and boundary type. Use postal, administrative, healthcare, electoral and other specialist maps, then add extra boundary overlays where they help.

Professional map customisation made simple
Turn boundaries and spreadsheet data into polished sales territory maps, postcode maps, delivery zones, heat maps and location analysis. Choose a map, add your information and create a result ready for reports, presentations, planning and print.
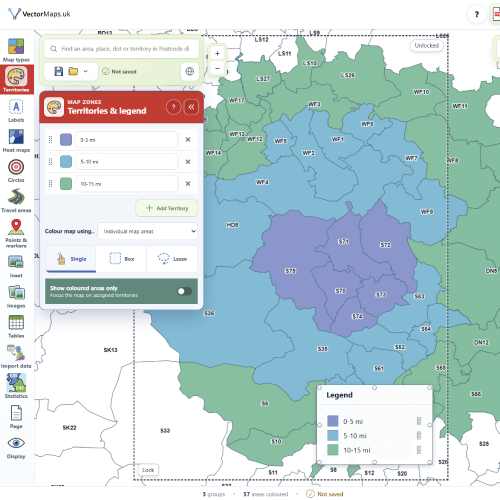
Start with a professionally prepared map, then work visually. You can create a useful first result in minutes and still have the detailed controls needed for serious analysis and finished artwork.
Search the growing library by country and boundary type. Use postal, administrative, healthcare, electoral and other specialist maps, then add extra boundary overlays where they help.
Colour areas by hand or import Excel and CSV data. Create territories, graduated heat maps, statistics, labels, markers and keys without rebuilding the map from scratch.
Refine linework, fills, hatching, labels, insets and page artwork. Add distance or travel analysis, then export a crisp map for screen, documents or large-format print.
Group neighbouring areas, assign colours, add names and place labels directly on each territory. Use solid or hatched fills, outline complete groups and keep the map readable even when one person or team covers several separate areas.
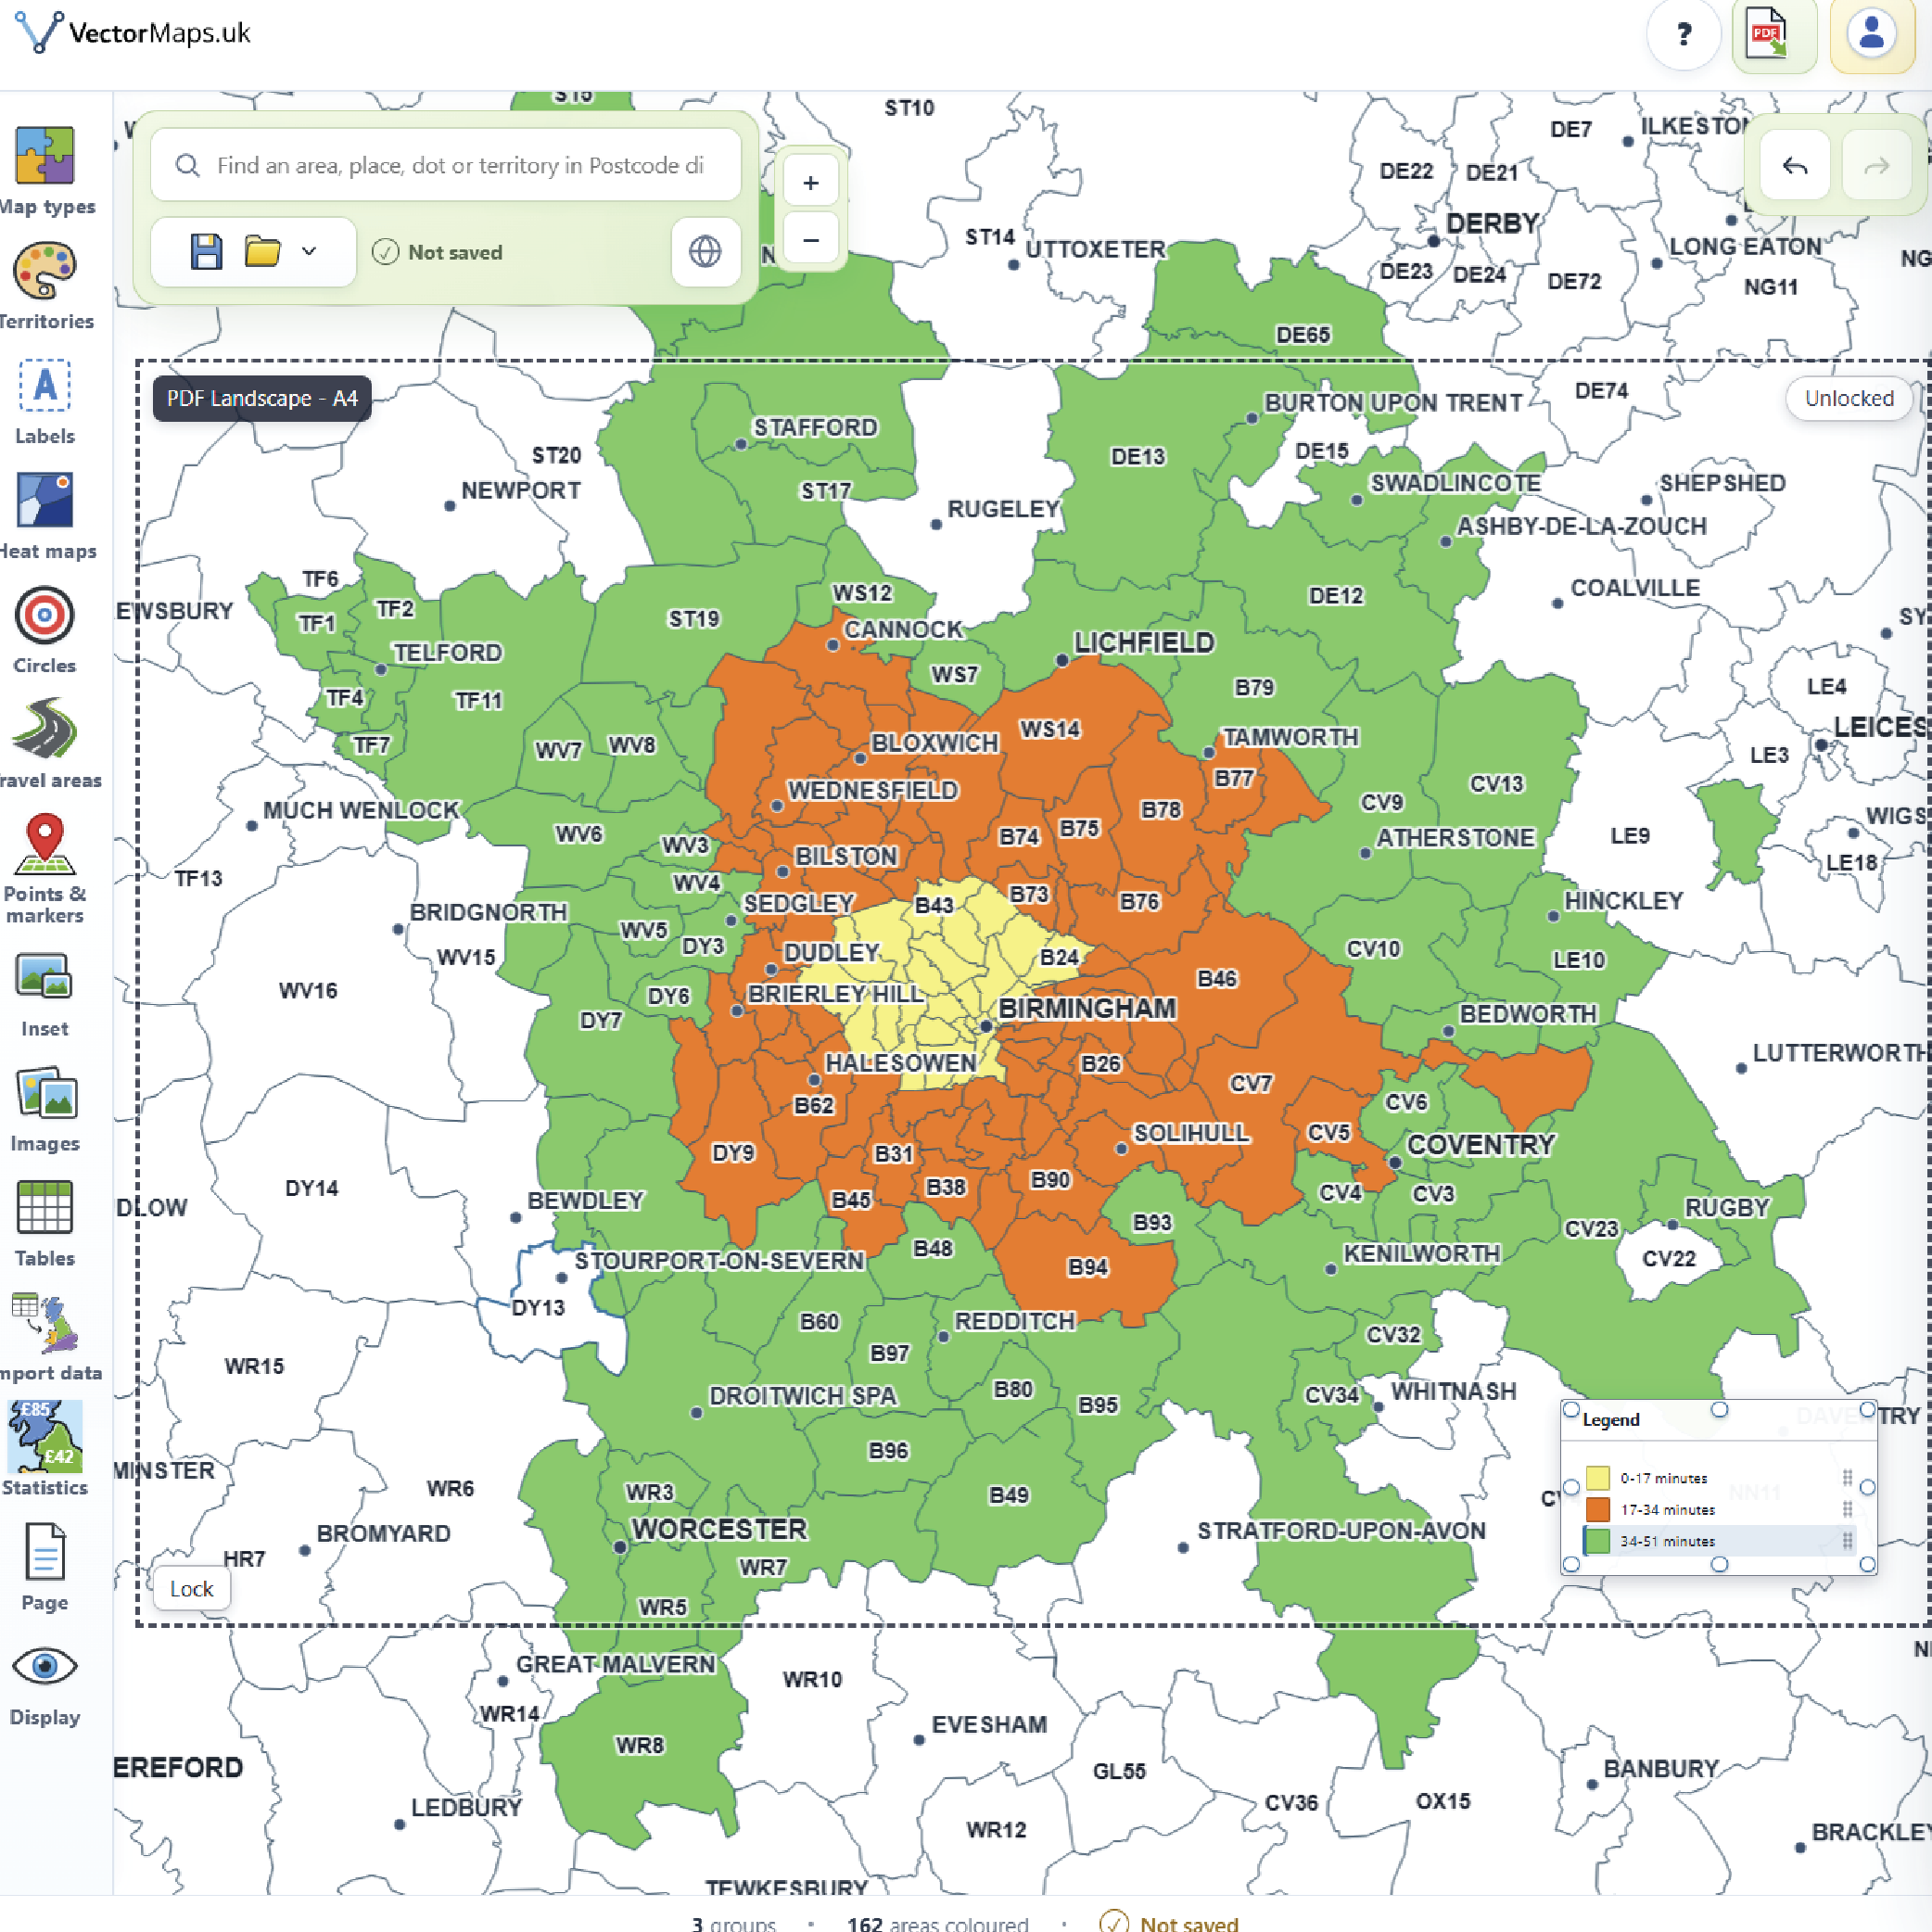
Build postcode delivery zones from travel times, distance bands or your own service-area assignments. You can also import numerical data and turn it into a clear thematic heat map, with complete control over classes, colours, precision and legend wording.
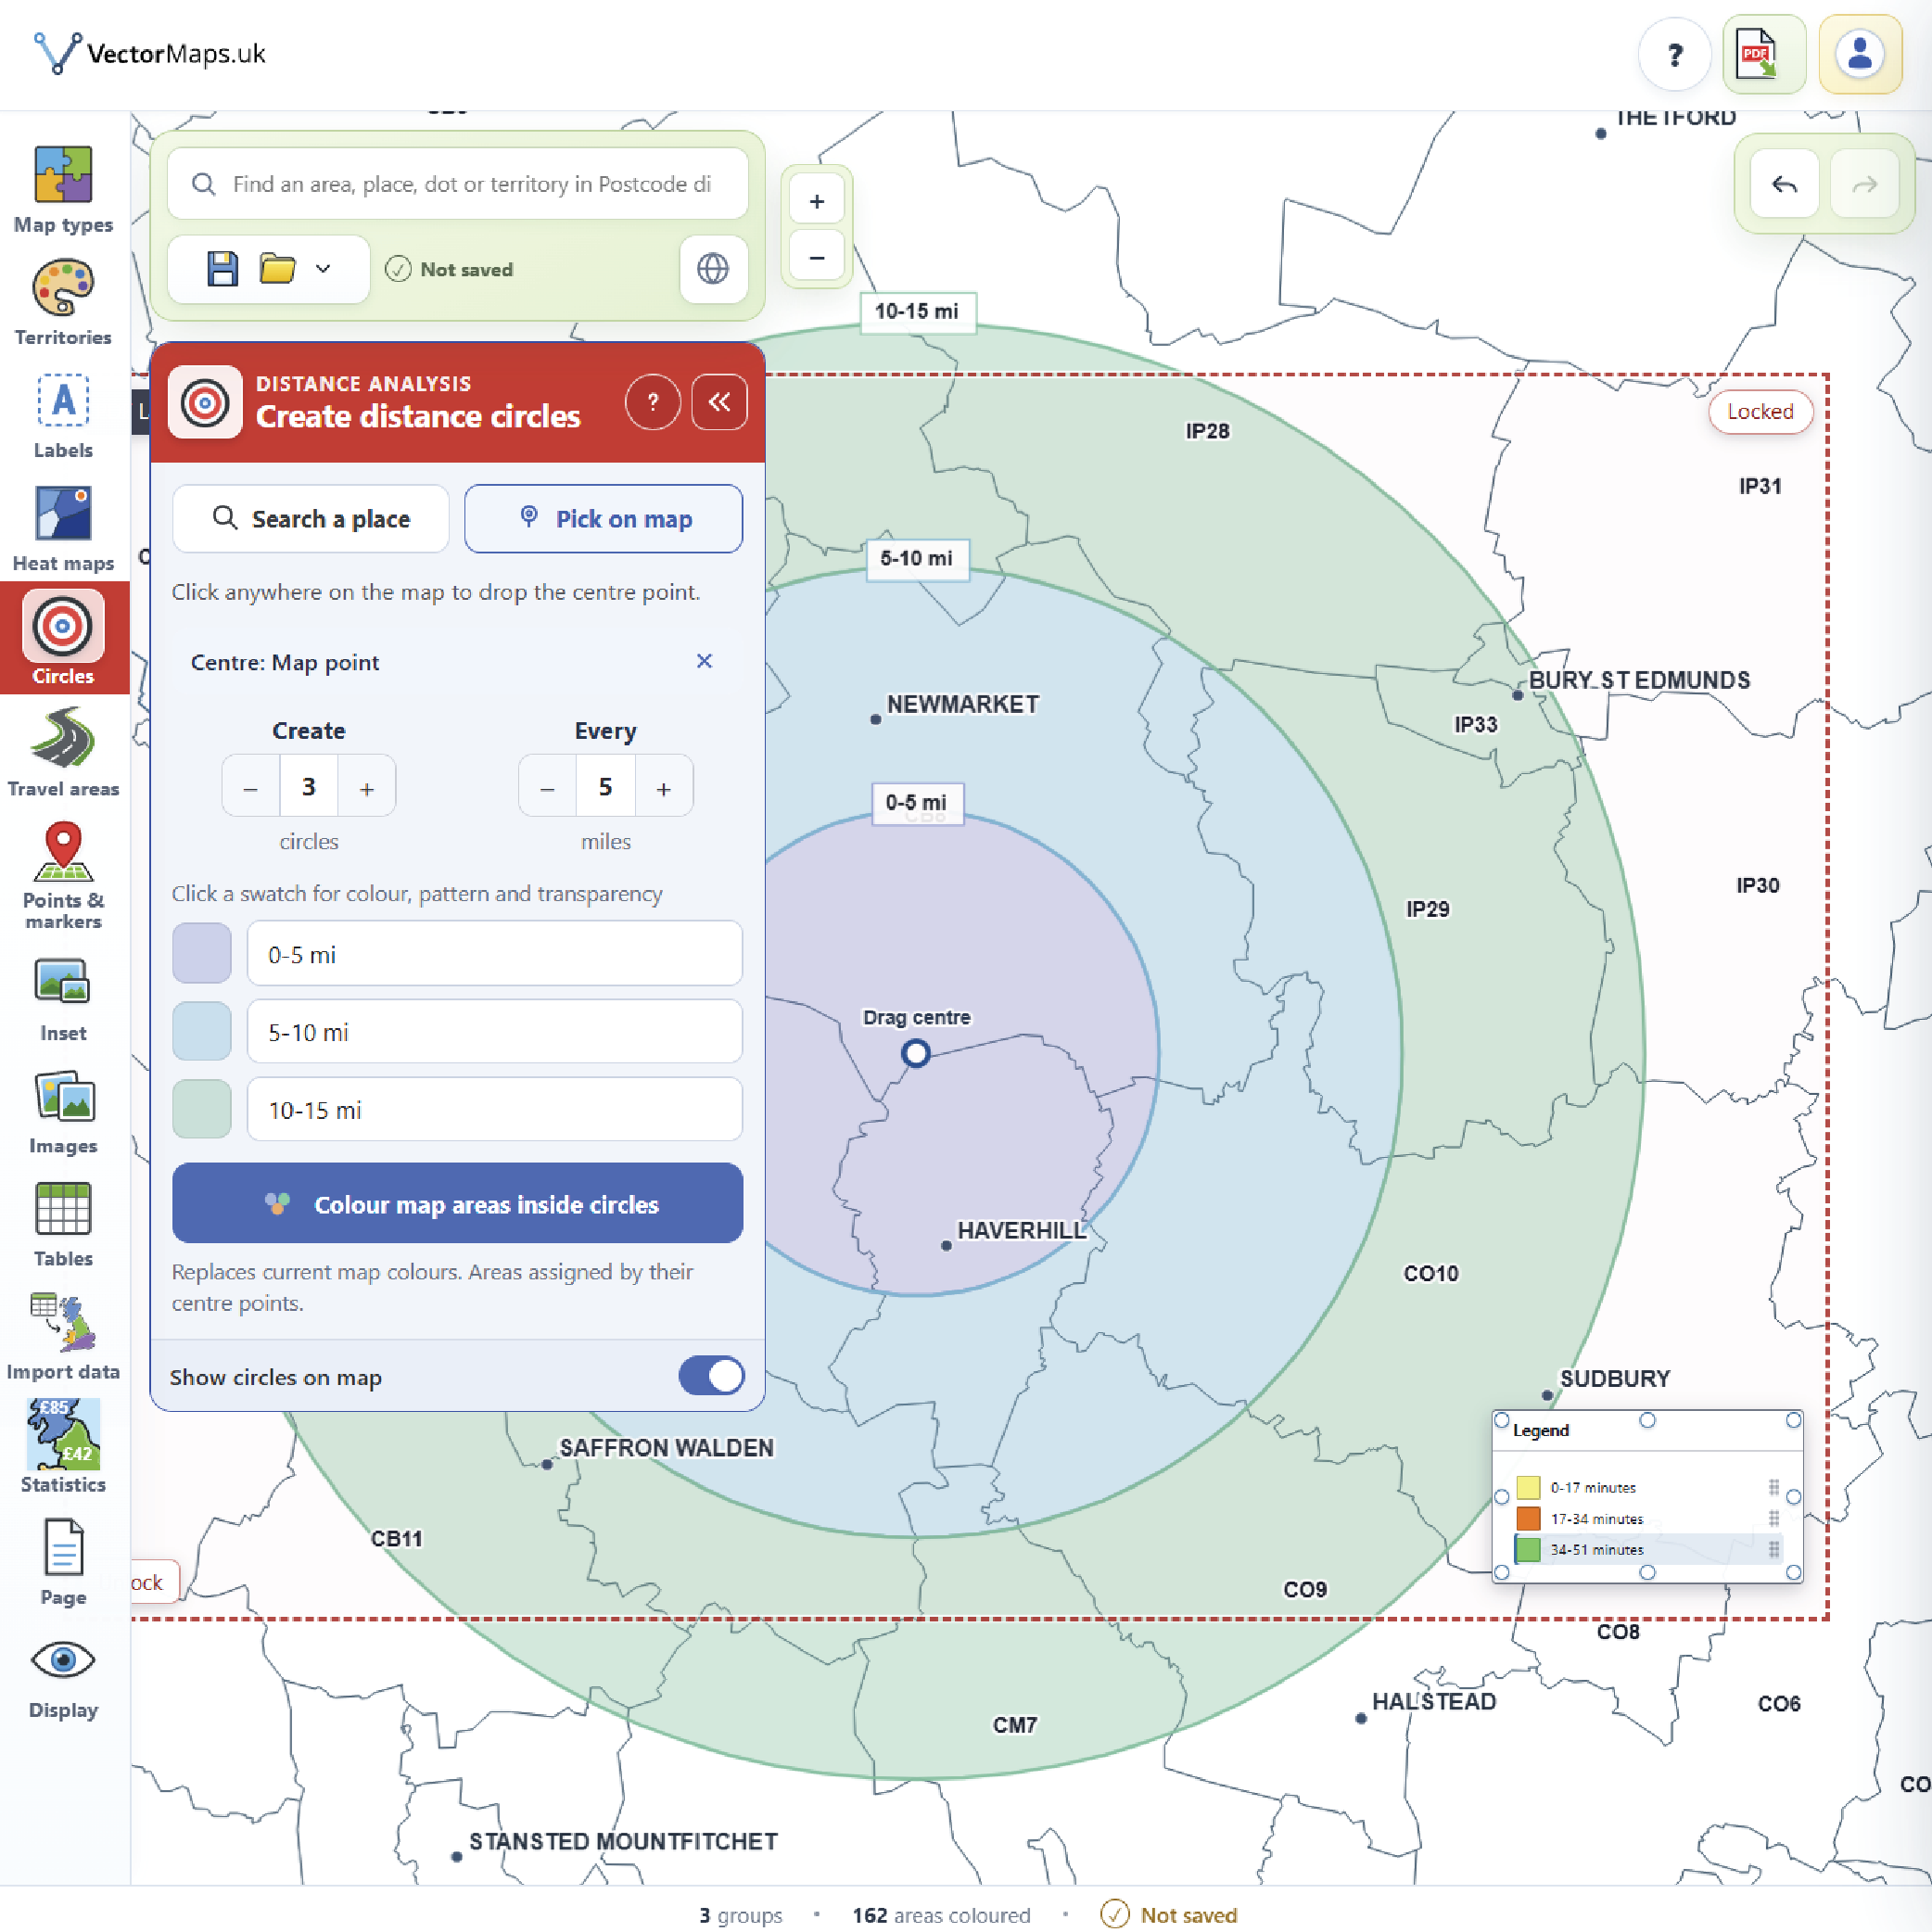
Go beyond colouring boundaries. Add distance bands, drive-time areas, dots, symbols, markers and labelled callouts. Combine them with inset maps and supporting statistics to explain both the pattern and the place.
Work across the UK, Europe, North America and the wider world without buying a separate application for every boundary type. New maps and new features are added regularly, so Full Access becomes more useful over time.
Explore the map libraryUse the same familiar workspace for everyday postcode map design, business planning, customer communication and detailed location analysis.
Divide customers, prospects or branches between representatives and label every separate territory clearly.
Show postcode delivery areas, mileage bands, travel times, service levels or different delivery charges.
Colour postcode areas, districts, sectors or full postcodes and combine them with settlements and boundary overlays.
Turn sales, population, demand, performance or percentage data into graduated colour classes.
Present franchise coverage, engineer patches, healthcare areas, regional teams or operational responsibility.
Arrange titles, legends, insets, images, statistics and tables into artwork suitable for print or screen.
Set the page to portrait or landscape and choose an A-series size from A4 to A0. Keep the quality of fine boundaries, labels and patterns with PDF or SVG, or generate a high-resolution PNG, JPEG or WebP image for everyday use.
Map data can also be exported as CSV, helping you retain the area names, values, groups and colours behind the design.
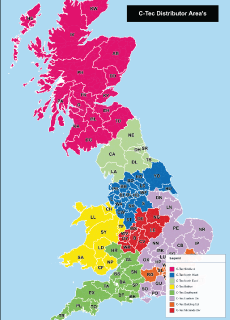 PDF sample
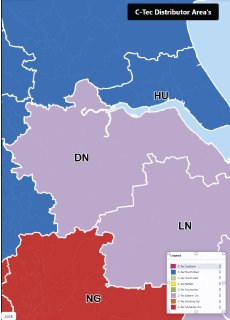 PDF sample
Short videos and task-based help explain the tool in plain language. The map catalogue and feature set are updated regularly, and friendly support is available when your question needs a person rather than another manual.
Start with the interface overview, or jump straight to the task you want to complete. Every video opens in a new tab, so your map stays exactly where you left it.
| Tutorial | What it covers | Time | Video link |
|---|---|---|---|
| 01VectorMaps User Interface Overview | Start here | 4:14 | Watch |
| 02How to Choose Map Types and Add Boundary Overlays | Map library | 4:35 | Watch |
| 03Change Map Display Options | Appearance | 1:08 | Watch |
| 04Create and Edit Map Territories | Territories | 2:06 | Watch |
| 05Import Excel or CSV Data to Colour a Map | Data import | 1:40 | Watch |
| 06Create a Heat Map from Spreadsheet Data | Heat maps | 2:37 | Watch |
| 07Configure Map Labels and Titles | Labels | 3:55 | Watch |
| 08Create Radius and Distance Circles | Distance | 2:25 | Watch |
| 09Create Travel Areas and Isochrones | Travel analysis | 2:58 | Watch |
| 10Add Dots, Markers, Callouts and Location Keys | Map points | 6:00 | Watch |
| 11Add Statistics to Map Territories | Statistics | 2:49 | Watch |
| 12Add and Configure an Inset Map | Inset maps | 3:41 | Watch |
| 13Add Images and Logos to a Map | Page artwork | 2:02 | Watch |
| 14Add an Excel or CSV Table to a Map | Map tables | 1:35 | Watch |
| 15Set Up the Map Page for Export | Export | 1:49 | Watch |
You can start using the Map Designer for free. These answers cover the most common questions about territory mapping, postcode maps, delivery zones, imports and exports.
Try the Map DesignerYou can create sales territories, service areas, franchise regions, postcode maps, delivery zones, heat maps, travel-time maps and other professional boundary-based maps.
Yes. Choose an appropriate postcode boundary map, colour areas manually or import assignments, and add distance circles or travel-time areas to design clear delivery and coverage zones.
Yes. Spreadsheet data can colour territories, build thematic heat maps, add statistics, place points and create supporting map tables. Downloadable sample files show the expected column headings.
Full Access supports professional PDF and SVG vector output plus high-resolution PNG, JPEG and WebP images. You can also export the area, group, value and colour data as CSV.
No. The tool is designed for ordinary business users, with visual controls, short tutorials and task-based help. Advanced styling and analysis options remain available when you need them.
Open the Map Designer, choose a boundary and see what your information can become. Upgrade only when you need saving, professional exports and the complete toolset.